
What is the Stream Monitor?
The Stream Monitor is a comprehensive monitoring tool that lets you track the health and availability of your audio streaming service in real time. The monitor checks your stream at regular intervals and automatically detects issues such as outages, silence, and quality degradation.
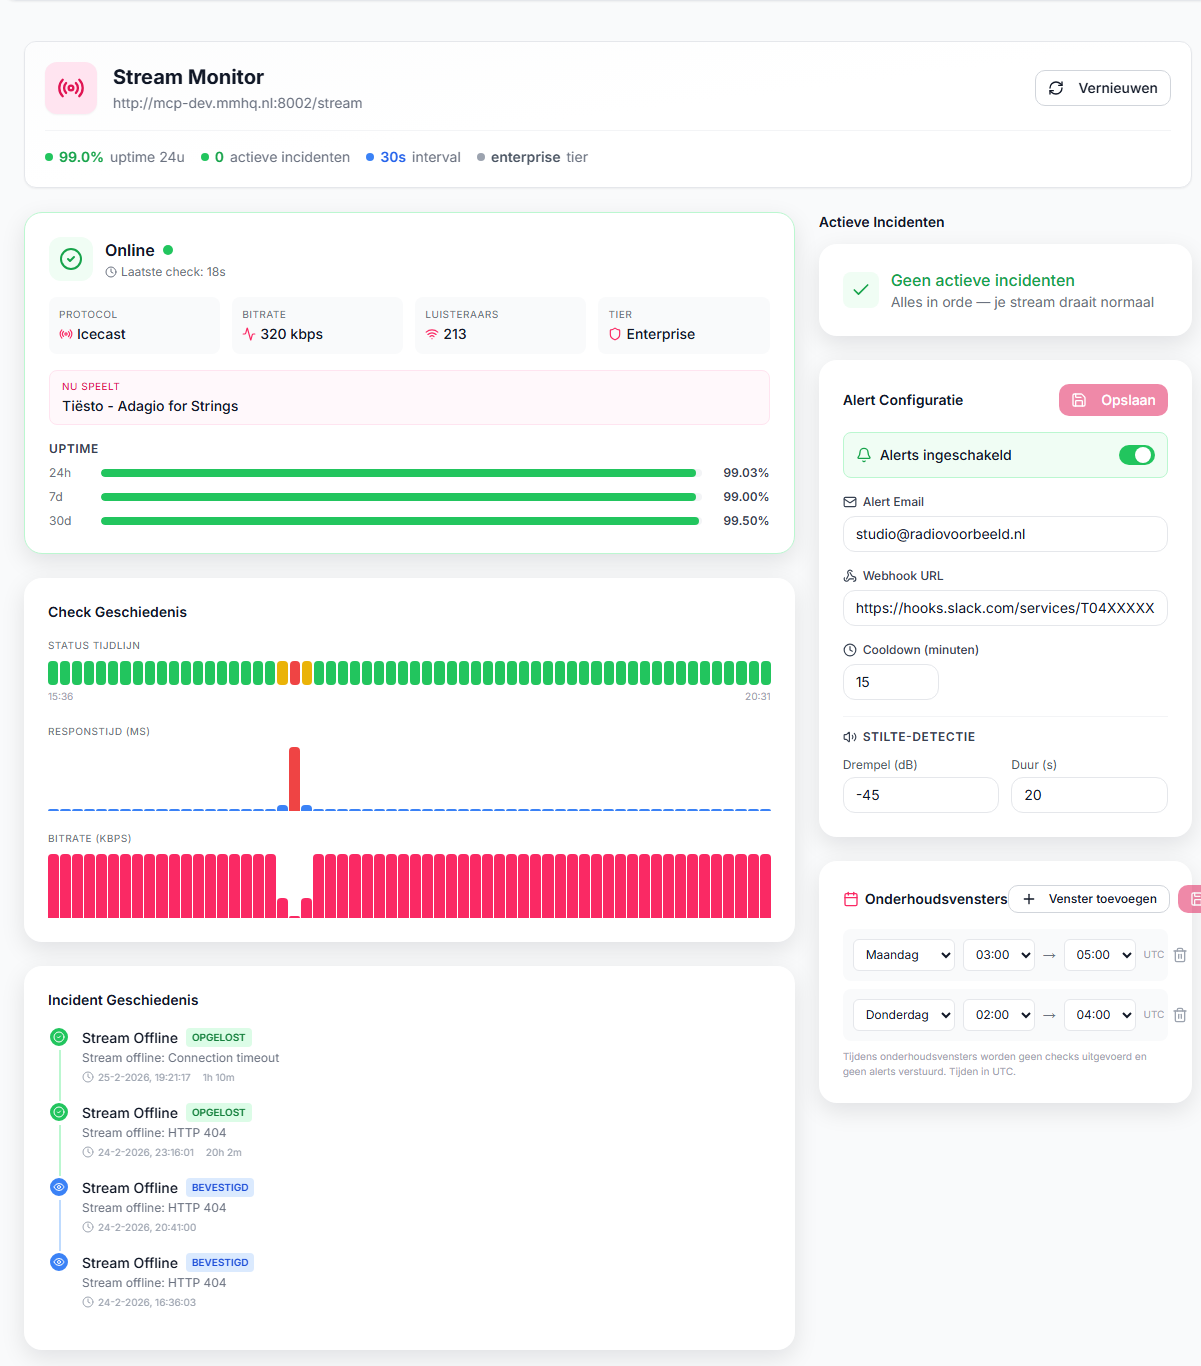 Stream Monitor Dashboard
The Stream Monitor is available as an add-on to your audio streaming package and is offered in three subscription tiers: Basic, Pro, and Enterprise.
Subscription Tiers
The Stream Monitor is available in three tiers, each with more features:
Basic
- Check interval: every 5 minutes
- Online/offline status detection
- Uptime statistics (24 hours, 7 days, 30 days)
- Email notifications on outages
- Incident history
Pro
All Basic features, plus:
- Check interval: every 1 minute
- Silence detection — detects when your stream is silent (configurable threshold)
- Metadata monitoring — tracks what's currently playing and detects stuck metadata
- Advanced incident types (silence, bitrate drop, stuck metadata)
Enterprise
All Pro features, plus:
- Check interval: every 30 seconds
- Multi-mount point monitoring — monitor multiple mount points (e.g., main, mobile, fallback) simultaneously
- Webhook notifications — receive real-time notifications via webhook with HMAC-SHA256 signing
- Maintenance windows — schedule times when notifications are suppressed
The Dashboard
After activation, you can find the Stream Monitor in your dashboard under Services > [Your Streaming Service] > Manage > Stream Monitor.
Status Page
The main page shows an overview of your stream:
- Current status — Online, Offline, Silent, Degraded, or Error
- Protocol — Shoutcast or Icecast
- Subscription tier — Basic, Pro, or Enterprise
- Last check — time of the most recent check
- Uptime percentages — availability over 24 hours, 7 days, and 30 days
Check History
A visual timeline shows the results of recent checks. Each check records:
- Status (online/offline/silent/degraded/error)
- Response time in milliseconds
- Bitrate (kbps)
- Audio level (dB)
- Current track (artist and title)
- Listener count
- AutoDJ status
Active Incidents
When an issue is detected, an incident appears on the dashboard. Incidents include:
- Type — offline, silence, bitrate drop, stuck metadata, AutoDJ failover, high latency
- Severity — warning or critical
- Start time and duration
- Description of the issue
You can acknowledge incidents to indicate you're aware of them.
Setting Up Notifications
Email Notifications
By default, notifications are sent to your account email address. You can customize this:
- Go to Stream Monitor > Settings
- Enable Notifications
- Enter a Notification email address
- Set the Cooldown period (default: 15 minutes) — this prevents you from being flooded with notifications
Webhook Notifications (Enterprise)
For advanced integrations, you can set up webhook notifications:
- Go to Stream Monitor > Settings
- Enter your Webhook URL
- Webhooks are sent with an HMAC-SHA256 signature in the
X-Maenda-Signatureheader
Webhook payload example:
{
  "event": "incident.offline",
  "timestamp": "2025-02-25T12:00:00Z",
  "monitor": {
    "id": "mon_123",
    "serviceId": "svc_456",
    "streamUrl": "https://stream.example.nl:8000/live",
    "tier": "enterprise"
  },
  "incident": {
    "id": "inc_789",
    "type": "offline",
    "severity": "critical",
    "status": "active",
    "startedAt": "2026-02-25T12:00:00Z",
    "description": "Stream is unreachable"
  },
  "check": {
    "status": "offline",
    "responseTimeMs": 10000,
    "bitrate": null,
    "audioLevelDb": null,
    "isSilent": false,
    "nowPlaying": null
  }
}
Webhook events:
incident.{type}— new incident detected (e.g.incident.offline,incident.silence)incident.resolved.{type}— incident resolved (e.g.incident.resolved.offline)
Every webhook also includes the headers X-Maenda-Event (the event name) and X-Maenda-Signature (the HMAC-SHA256 signature).
The webhook retries up to 3 times with increasing delay (1s, 5s, 15s) on failed delivery.
Protection against false alerts
A brief hiccup isn't necessarily an outage. That's why the monitor only creates an offline incident after several consecutive failed checks (configurable). This prevents false alarms from a one-off spike, while a real outage is still reported quickly. The individual checks are always recorded, so your uptime figures stay accurate.
Silence Detection (Pro & Enterprise)
Silence detection recognizes when your stream is technically online but not broadcasting audio. This is essential for radio streams where silence can be a serious issue.
How It Works
The monitor analyzes 32KB of audio data from your stream and calculates:
- Byte variance — how varied the audio data is
- Shannon entropy — information content of the audio signal
- dB level — estimated sound level (RMS and peak)
Silence is detected when byte variance is below 50 AND entropy is below 5.0 bits.
Adjusting Thresholds
- Go to Stream Monitor > Settings
- Adjust the Silence threshold (default: -50 dB)
- Set the Silence duration (default: 30 seconds) — how long silence must last before an incident is created
Multi-Mount Point Monitoring (Enterprise)
If your stream has multiple mount points (e.g., /live, /mobile, /fallback), you can monitor them all simultaneously.
Setup
- Go to Stream Monitor > Settings
- Add your Mount points as a list
- Each mount point is checked individually
- Incidents are tracked per mount point
Maintenance Windows (Enterprise)
Schedule periods when notifications are suppressed, for example during planned maintenance or nightly tests.
Setup
- Go to Stream Monitor > Maintenance Windows
- Select the day (Monday through Sunday)
- Set the start and end hour
- During maintenance windows, no notifications are sent, but checks continue normally
Supported Protocols
The Stream Monitor supports the two most commonly used streaming protocols:
Shoutcast
- Fully supported with ICY metadata
- Automatic listener detection via the statistics page
- AutoDJ detection
Icecast
- Fully supported with ICY metadata
- Support for multiple mount points
- Metadata parsing for now-playing information
Both protocols support:
- HTTPS/TLS connections
- Automatic redirect following
- Bitrate detection via ICY headers
- Artist and title information
Incident Types
The Stream Monitor can detect the following issues:
| Type | Description | Minimum Tier |
|---|---|---|
| Offline | Stream is unreachable | Basic |
| Silence | Audio is silent (below threshold) | Pro |
| Bitrate drop | Bitrate is lower than expected | Pro |
| Stuck metadata | Same track displayed for too long | Pro |
| AutoDJ failover | AutoDJ has taken over (live DJ dropped) | Pro |
| High latency | Response time is abnormally high | Basic |
Uptime Statistics
The Stream Monitor automatically calculates uptime percentages:
- 24 hours — availability over the past day
- 7 days — availability over the past week
- 30 days — availability over the past month
These percentages are calculated based on the number of successful checks relative to the total number of checks. Maintenance windows are excluded from the calculation.
Frequently Asked Questions
How quickly am I notified of an outage?
This depends on your subscription tier:
- Basic: maximum 5 minutes
- Pro: maximum 1 minute
- Enterprise: maximum 30 seconds
Can I use the Stream Monitor without a streaming package?
No, the Stream Monitor is an add-on that is linked to an existing audio streaming package at Maenda Media.
What happens during a maintenance window?
Checks are still performed and recorded, but no notifications are sent. Incidents are still created for record-keeping.
How do I verify the webhook signature?
The webhook contains an X-Maenda-Signature header with the format sha256=<hex>. Calculate the HMAC-SHA256 of the request body with your secret key and compare it with the value in the header.
Can I export historical data?
Yes, via the Stream Statistics page you can export data as CSV or PDF. This includes listener counts, bandwidth, and peaks over the selected period.
Does the monitor also detect video issues?
No, the Stream Monitor is specifically designed for audio streams (Shoutcast/Icecast). Video streaming has a separate statistics panel.